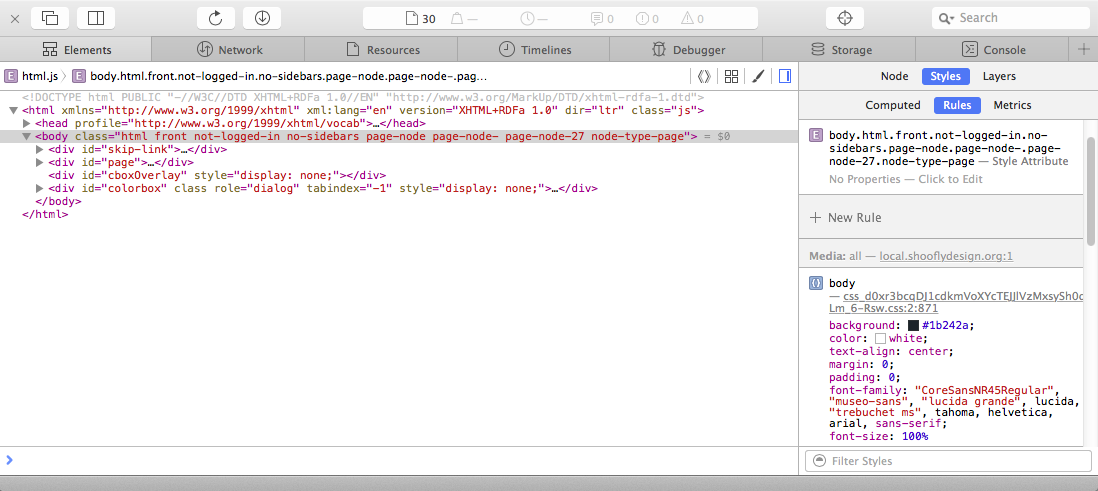
Web Inspector Improved in Safari 9
I haven't upgraded to El Capitan, and may not for a while, but the latest version of Safari is 9.0, and is available for OS X Mavericks, aka 10.9. I upgraded to stay current with the security fixes, and have been pleasantly surprised to see a much improved Web Inspector.

The main thing I'm enjoying so far is the performance: once again, this tool is fast. When they redesigned it to look like Xcode's debugging tools, maybe a few years ago, not only was the UI sort of weird and confusing, it was slower. As a result, although I use Safari as my main browser, my main development browser had to be Chrome (or occasionally Firefox). Chrome still has the richest feature set for JavaScript debugging and performance testing, but now I can work in Safari again without feeling cheated.
One little thing I've noticed is that you can close tabs — hover over a tab and a little X will appear. So if you're just getting started with the Web Inspector and don't want to see all the tools at once, or otherwise just want to hide some for a while, you can close them. The plus button on the right side will open a new one, and let you choose from any you've closed. Don't be fooled, though, you can't open two copies of the same tab!
The Surfin' Safari blog has covered the updates throughout the beta period. I wasn't keeping up with these because I assumed the updates were only for Yosemite and El Capitan. I have a lot of reading to catch up on!
- Styles sidebar improvements
- The rendering frame timeline
- JavaScript type and code coverage profiling
- Other user interface changes
I'm glad that Apple has made these changes, and I'm very happy that they're continuing to support Mavericks.
